STATS

& THOUGHTS

Step-by-step guides on statistical approaches, the papers published which led me to them, and other problems that made me angry.

Publications Gabriel Hales Publications Gabriel Hales

Rethinking “screen time”: How online play boosts students’ academic skills

Public conversations about “screen time” in adolescence often start and end with worry that time online must be stealing attention from school. Our newly published paper asks a different question: What if some of that unstructured time on social media, video games, and general web browsing builds skills that help students do better in school?

Public conversations about “screen time” in adolescence often start and end with worry that time online must be stealing attention from school.

Our recently published paper, co-authored with Keith Hampton, asks a different question: what if some of that unstructured time on social media, video games, and general web browsing builds skills that help students do better in school?

We find evidence of a compensatory mechanism. The “harms” of social media use on academic achievement are more than offset by larger positive, indirect relationships that run through digital skills, especially for boys, and particularly in reading and writing.

Background and motivation

For decades, youth unstructured and leisure time has shifted from unsupervised “free play” toward adult-organized activities, such as organized sports, school-sanctioned and/or led extracurriculars. Digital leisure, such as time spent on social media and video games, has been treated by many as the latest distraction.

However, casual, self-directed use and online exploration can cultivate transferable skills and abilities, particularly among adolescent students. These abilities, which we measure as “digital skills,” track closely with academic competencies and testing across reading, writing, and math domains.

Primary findings

1. Direct effects between screen time (specifically, social media) and academic achievement are small and specific.

More time on social media shows a small negative direct association with achievement (for girls, in reading, writing, and math; for boys, in writing only). No other digital activities show robust direct downsides.

2. Digital skills are strong, consistent predictors of adolescent achievement.

A one-standard-deviation increase in social media skills corresponds to ~4–5 percentile gains in reading and writing and ~3 in math; internet skills also predict gains, though somewhat smaller. In several domains, the influence of digital skills approaches that of GPA.

3. Digital leisure helps build those skills.

Web browsing and gaming are linked to higher internet skills for both girls and boys, with stronger returns for boys. Social media use is linked to higher social media skills for both, though again more strongly for boys.

4. The indirect pathway (connecting screen time to achievement through skills) is positive, and often larger than the direct downside.

Time spent on social media, web browsing, and gaming is indirectly associated with higher SAT scores because it boosts digital skills. For boys, the indirect benefits are substantial in reading and writing as well as math; for girls, the benefits are positive but smaller.

5. Net effect of connectivity on achievement is positive for boys across domains, but mixed for girls.

When we combine direct and indirect paths, boys show a net positive association between digital media use and scores in all three subjects. For girls, the net effect is neutral in reading and writing (indirect benefits offset small direct downsides) and modestly positive in math.

Gender gaps in online & academic skills

Common stereotypes predict “gaming helps boys in math” and “social media helps girls in reading.” We find something more nuanced. Yes, boys’ heavier engagement with games and the open web appears to drive larger gains in broadly useful digital skills. But those skills relate not just to math; they also map onto reading and writing. The result is a potential narrowing of gender gaps in literacy, with only a small reinforcement of boys’ edge in math. That said, girls’ returns from the same activities are smaller—likely reflecting differences in what they do online, for how long, and which skills those activities cultivate.

Our methodology

We surveyed 2,582 students in grades 8–11 across 13 rural Michigan school districts (spring 2019). We combined self-reports of typical weekday media use (social media, web browsing, video games, TV/video), validated indices of internet and social media skills, and district-provided SAT Suite scores in math, reading, and writing (percentiles). Using a path model, we tested both:

  • Direct links from time on each digital activity to SAT scores; and

  • Indirect links that run from time on activities → digital skills → SAT scores.

Testing for gender differences: We ran the model separately for girls and boys to probe gender differences, while adjusting for socioeconomic factors, GPA, homework completion, accommodations (IEP), and home internet access. Inaccessible or missing data were addressed via multiple imputation.

Figure 1 of Hales and Hampton 2025 paper in ICS journal, showing the model of the direct and sum of direct and indirect (‘total’) relationships between digital media use, digital skills, and academic achievement.

Figure: Simplified model of the analyzed direct and sum of direct and indirect (‘total’) relationships between digital media use, digital skills, and academic achievement.

Key takeaways

The debate about adolescent screens has been stuck on the minutes substracted, or stolen from schoolwork. However, our findings point to a more nuanced story of addition.

We find evidence that when adolescents use the internet to explore, make, coordinate, and play, they practice and develop the very competencies that standardized tests and other measures of youth achievement reward. When considering these skillsets, the so-called “harms” of screen time are non-existent, and actually prove to be beneficial for many, particularly for boys.


Recommended citation

Hales, G. E., & Hampton, K. N. (2025). Rethinking screen time and academic achievement: Gender differences and the hidden benefit of online leisure through digital skills. Information, Communication & Society, 1–19. https://doi.org/10.1080/1369118X.2025.2516542

Read More
Publications Gabriel Hales Publications Gabriel Hales

When avatars shape us: VR makes the “Proteus effect” stronger

Synthesizing fifty-six experimental studies of the “Proteus effect” (meta-analysis), we examined what conditions make the proteus effect stronger rather than whether or not it exists. The cautious answer: the Proteus effect is robust but probably a bit smaller than headline estimates, and still stronger in VR.

The Proteus effect: the phenomena that people tend to align their feelings and behaviors with the identity of the online avatar they embody/inhabit while online.

If your avatar looks taller, you feel more confident; if it looks athletic, you might push a little harder in a workout. Our meta-analysis paper takes stock of the most reliable existing studies of this effect and asks:

When does the Proteus effect show up most reliably?

The cautious answer: the Proteus effect is robust but probably a bit smaller than headline estimates, and still stronger in VR.

What we did (methods)

Synthesizing 56 experimental studies of the Proteus effect using meta-analysis, we examined what conditions make the proteus effect stronger rather than whether or not it exists.

Two characteristics of prior study designs stand out:

  1. Hardware modality: studies using virtual reality (VR) headsets versus flat screens.

  2. Software type: studies using commercial, off-the-shelf software versus custom-built research software.

Headline findings

  • The Proteus effect is reliable, small-to-medium in size.

  • VR produces stronger Proteus effects than flat screens… Embodying an avatar in VR typically moves people more than piloting the same kind of avatar on a monitor.

  • Commercial vs. custom software? We find no clear winner… Studies using professionally produced platforms and those using bespoke research software showed statistically similar effect sizes.

The best theoretical reason for why VR might matter more is likely: avatar embodiment. VR more often links physical movements to the digital avatar in real time, narrows your sensory (visual, auditory) field to the virtual scene, and elevates feelings of self-presence, i.e., a felt sense of “being there.”

Key takeaways

Across five dozen experiments analyzed in our study, we found signficant evidence that adopting an avatar tends to nudge people toward that avatar’s identity (i.e., the “Proteus effect”), and VR makes that nudge significantly more reliable when under observation.

Scholars of the Proteus effect should design future studies responsibly: amplify embodiment where beneficial, measure and report design details transparently, preregister analyses, and build safeguards for when identity cues might push too hard. Done well, avatar design can be a lever for skill building, empathy, and healthier habits—not just a costume change.


Recommended citation

Beyea, D., Ratan, R., Lei, Y., Liu, H., Hales, G. E., & Lim, C. (2022). A New Meta-Analysis of the Proteus Effect: Studies in VR Find Stronger Effect Sizes. PRESENCE: Virtual and Augmented Reality, 31, 189–202. https://doi.org/10.1162/pres_a_00392

Read More
Statistics Gabriel Hales Statistics Gabriel Hales

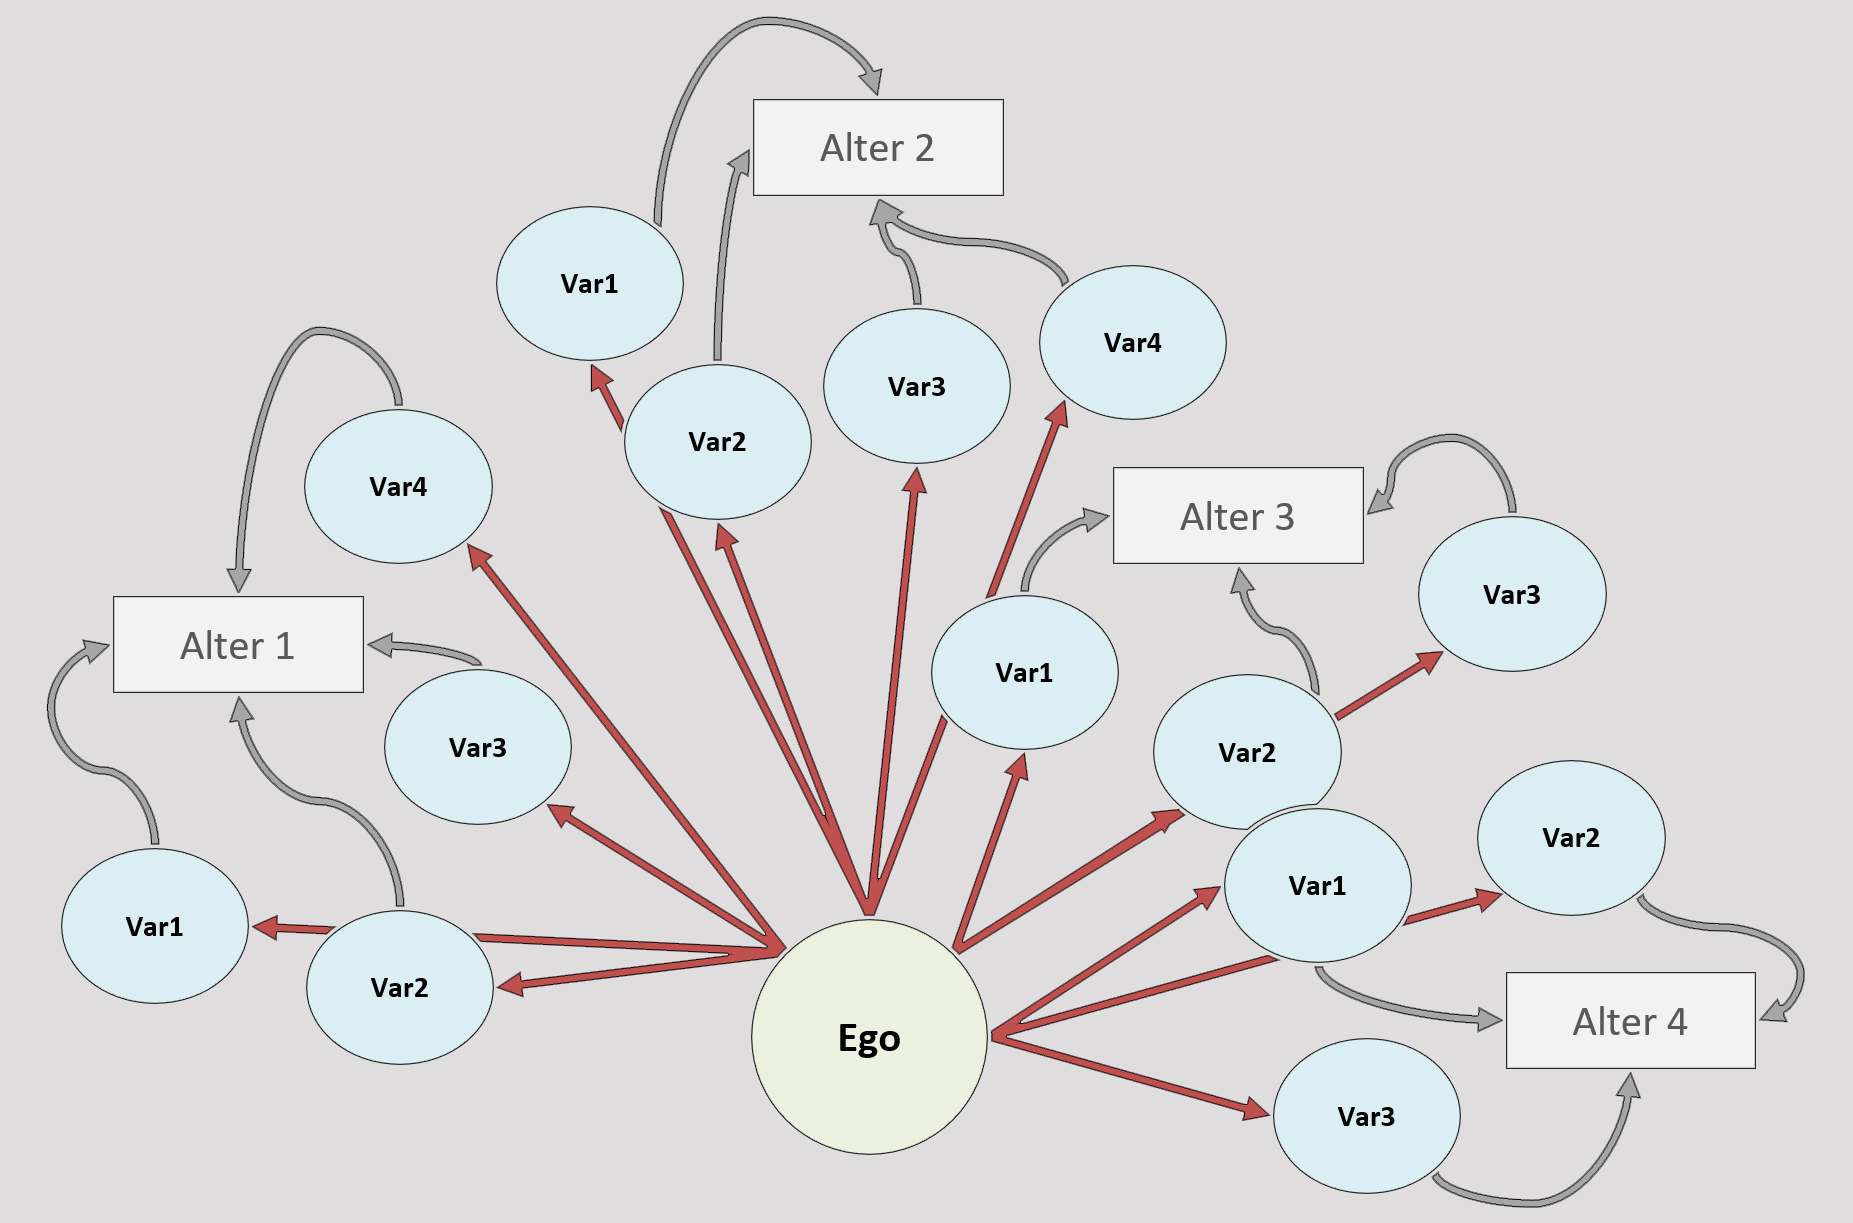
How to analyze alter-level attributes within egocentric network data using SPSS

This write-up adds a much-needed update to Muller et al.’s (1999), “how to use SPSS to study ego-centered networks” by reviewing the process of restructuring and transposing name generator survey data in SPSS. Key takeaways: (1) prep your data with a simple, sequential naming scheme, (2) restructure “variables into cases” and ensure your named variable groups are those which need to be transposed, (3) categorize key ego-level variables as “fixed” and generate a cluster ID (index) variable to help with MLM analysis, and, lastly, (4) save the restructuring command in SPSS syntax to verify and ensure all steps were completed correctly. Good luck!

Analyzing alter-level attributes with network data: a step-by-step guide.

[See original presentation here]

Key Takeaways

  1. Prep: Create a simple, sequential naming scheme for variable groups (compiled alter-types from IM generators; e.g., s1-5, t1-5). “Save as” before restructuring.

  2. Transpose: Select Data>Restructure and choose to restructure variables into cases. Move ordered variables from each var group into “variables to be transposed,” rename each target variable (e.g., s1-5 within “trans1,” renamed “sex1”).

  3. Categorize: Denote key ego-level variables as “fixed variable(s).” Create cluster ID (index) variables to identify each alters’ IM topic type.

  4. Restructure: Execute or save the command to a syntax file (latter is recommended). Verify the dataset is correctly restructured — alters at level 1 and ego-level values duplicated for level 2.


The following is (my attempt) at a much-needed update to Muller et al.’s (1999), How to use SPSS to study ego-centered networks.”

Background & Review of Terms

Egocentric or “core” social networks

An individual’s “core” network of their closest relationships (close ties; i.e., relationships with their closest friends/kin) (see [1][2]). Composed of the select few individuals who provide the most support to the ego, often not including more than five others.

Gathering core network data with surveys

Personal networks are most often measured by asking participants about who they discuss “important matters” (IM) with (i.e., the “IM generator”; see [3][4]). In this approach, respondents/”egos” provide the name of someone else based on this question (ostensibly their closest tie), who is then sought out themselves to eventually generate a broader social network.

Some survey instruments go deeper, including the R5D [5], which utilizes multiple topic-specific IM generators. Basically, it prompts a variation of the “important matters” question, asking each participant to name not just one person that provides them “core” support, but five different names for the five varying and most important types of support. The R5D consists of one to five boxes for names to be provided corresponding to the following topics: family-based support, career support, financial support, general welfare and happiness support, and support for health and well-being.

Compiling these topic-specific alters, the information provided for each of them, and considering them alongside the respondent subsequently creates an analyzable “core” network.

Egocentric network structure

Networks are inherently nested structures [6]. Meaning, nodes (alters) are nested within ties to other nodes nested within clusters of ties to other nodes and so on… That said, the usual approach to analyzing these structures is …

EGOs (person who takes the survey; participant, center of network) are at the individual, personal, or ‘ego’ level (level 1)

Through surveys, egos/respondents provide information about:

ALTERs (those connected/tied to ego; kin, classmates, close ties) are gathered via a name generator within survey and responses are composited to generate the ‘network’ level factors for each ego (level 2),


However, this is not the only way one could analyze the composition of personal networks.

Although the ego took the survey, therefore usually being the individual in a multilevel model, their alters can instead be observed as the smallest point in the structure since they are where the ties conclude. Doing so allows analysis of tie-level dependent variables [6][7] (e.g., social capital of a personal network, social support, and/or homophily) and the capacity to observe and control for other network characteristics, and how they interact within and between each level [8].

Case Study

To explain this methodology, I use an example ‘case study’ that includes a personal network survey dataset of incoming (freshman) undergraduate students and their families. The survey consists of roughly 900 students and 400 of their parents. Each participant provided five ties (alters) (via the R5D IM generators) and information about themselves (e.g., political ideology, attitudes and opinions, digital media use, etc.) as well as those in their network (e.g., perceived attitudes, on and offline connectedness, closeness).

This survey dataset is structured with egos at level 1, each having numerous variables with information about themselves, but also for each alter (those named in the R5D generators). This structure does not allow analysis of any alter-level dependent variable(s), and instead, only those at the ego-level, i.e., items which the respondent answered only about themselves. Alter-level characteristics would have to be compiled and averaged for any analysis. Therefore, we must restructure the dataset.

Data Management and Preparation

The case study survey data is originally structured with egos at “level 1,” each having numerous variables corresponding to questions asked about each alter via the R5D name generator. To begin the management and restructuring process, I’ve created a simple naming scheme to help me keep track of which of the five alters each alter-specific variable pertains to (i.e., family, career, finance, happiness, and health corresponds to 1-5, respectively) and assigned a letter to denote each “variable group” (i.e., s1-5, t1-5, etc.; see below).

The data (before restructuring) can be visualized as follows:

After this simple data management, count the number of variable groups you’ve created (i.e., a1-a5, b1-b5, and c1-c5 would be three var groupings). This is the total number of new alter-specific variables you will be creating.


Restructuring in SPSS

I cannot stress this enough before moving forward:

SAVE YOUR FILE AS A NEW DATASET.

Trust me. If you don’t already do this before each new command, especially those which rearrange your file structure, you surely will learn to do so in the near future.

Select the “Restructure…” command in the “Data” dropdown in SPSS. Ensure that you restructure variables into cases.

Enter the tallied number of new var groups in the bottom box, “more than one […]” (if creating more than one new alter-specific variable). Next, we specify the variable transposition.

From the dataset list on the left (see below), select all number-specified variables in a grouping (e.g., s1-s5) and drag or click the blue arrow to move them into the “variables to be transposed” box.

Rename “trans1” in the target variable” box to align with naming scheme (e.g., “trans1” renamed to “sex1” for s1-s5).

Repeat this process for each variable group you tallied above until all target variables in the dropdown are accounted for.

The case group identificationbox refers to an auto-generated ID variable with case-numbers for each newly transposed alter-level case (in this example, generated simply by adding another digit onto the original case/ID number). Feel free to rename and label it.

To denote which variables will be on the second level once transposed — i.e., vars with information provided by the original respondent (ego) about themselvesmove any ego-level var into the “fixed variable(s)” box on the bottom right. Doing so ensures they are not transposed and instead, their values are duplicated across each new alter-specific variable.

Note: if you have too many “fixed” variables and don’t want to sort through and select them in this tiny window (understandable), ignore this box and see below.

Click “next” and create an index variable, which will identify the TYPE of TOPIC corresponding to each new case once restructured, by sequentially assigning values from 1-5 to said cases (hence why an ordered naming scheme was recommended above).

With the next step, if you’d like to drop all non-categorized vars in your original dataset (i.e., all those not included as fixed or target variables), select “drop variable(s) from new file.” Or, select keep and treat as fixed variable(s)” to keep all remaining variables in the transposed dataset.

Lastly, either select to restructure the dataset immediately or have SPSS paste the command into a syntax file (I’d recommend the latter as to easily go back and re-run/check when something inevitably goes awry down the line) and click “finish.”


The dataset is now restructured and the previously separate, topic-specific IM variables transposed into composite variables typifying alter-level characteristics for each individual alter. Alters are at the first level with newly specified cases (new sample size is roughly 6,500 ), and the values for ego characteristics (now at level 2) are duplicated across each of their alters (see below).

Note: names w/ “1” denotes a level 1 var (i.e., s1, t1, m1, etc.); “2e” denotes level 2, ego (s2e, p2e, etc.).


Analyzing Restructured Data in Mplus

We are now ready to utilize your statistical software of choice to analyze. Here, I use Mplus — the best choice (which may or may not be biased by my lack of skills in HLM and R).

If you have not previously used Mplus with data cleaned and organized in SPSS, I’ve written a quick n’ easy how-to that reviews all the best practices to get you there. Similarly, even if you are ahead of the curve, or you just came back from that page (no judgement), I will indeed be doing a relatively brief review here, but will soon be posting a full write-up detailing multilevel modeling with core network data.

From here, the process is much like any other HLM analysis regarding model building. For instance, the Mplus syntax shown below is following Hox’s [9] Model 3, i.e., testing level 1 and 2 fixed effects [and, if relevant, interactions], and Model 4 [addition of random effects]. However, because of the restructuring and transposing method described above, many new capabilities that are often unavailable in core network research are included. For instance, and most significantly, the outcome is a level 1 variable, measuring how the alter and ego-level factors may relate to characteristics specific to each alter. This enables testing of between-level random effects to understand how changes in the ego, as well as those characteristics of their other network alters, may influence levels of alter-level homophily.

The MLM approach to core network analysis controls for the within and between level variances and biases of each individual alter in relation to a respective ego, and vice versa. That is, the nuances of core networks, including many other characteristics, past relationships, external stimuli (e.g., frequency of contact, shared experiences), and so on that are not explicitly measured here are controlled for — to the greatest extent that MLM is able — by the included multilevel interrelationships. When conceptualized appropriately, it is indeed very much like classic MLM examples where students are nested within classrooms, thus controlling for the variances and biases within and between such classrooms due to their teachers, relationships, and so on.


Footnote

In the example dataset used here, not every participant provided names for all five topic-specific IM generators. This is easily apparent when looking at descriptive statistics for the average network size of all egos (a fairly normal distribution from one to five). Unless enforced (which is not recommended), most personal networks surveys will show similar results. However, SPSS does not account for these issues — when restructuring, SPSS will generate the same number of alters (depending on the number of IM generators the survey included; in this case, five) for every participant whether they provided names for all of them or not. As such, further data cleaning is absolutely essential to ensure the total number of alter-level cases, and the characteristics considered when analyzing, is correct.

I will be writing up another post ASAP that will address this issue as it was a cruel and time-consuming one to figure out on my own. If you’re somehow reading this in between the time of writing and when I get it out there — god speed, traveller.


References

  1. Hampton, K. N., Sessions, L. F., & Her, E. J. (2011). Core Networks, Social Isolation, and New Media. Information, Communication & Society, 14(1), 130–155. doi.org/10.1080/1369118X.2010.513417

  2. Fisher, D. (2005). Using egocentric networks to understand communication. IEEE Internet Computing, 9(5), 20–28. doi.org/10.1109/MIC.2005.114

  3. Hampton, K. & Chen, W. (2021). "Studying social media from an ego-centric perspective." Personal networks: Classic readings and new directions in ego-centric analysis: 718-733.

  4. Marsden, P. V. (1987). Core Discussion Networks of Americans. American Sociological Review, 52(1), 122–131. doi.org/10.2307/2095397

  5. Hampton, K. N. (2022). A restricted multiple generator approach to enumerate personal support networks: An alternative to global important matters and satisficing in web surveys. Social Networks, 68, 48-59. doi.org/10.1016/j.socnet.2021.04.006

  6. Frank, K. A., Muller, C., & Mueller, A. S. (2013). The Embeddedness of Adolescent Friendship Nominations: The Formation of Social Capital in Emergent Network Structures. AJS; American Journal of Sociology, 119(1), 216–253. doi.org/10.1086/672081

  7. van Duijn, M. A. J., van Busschbach, J. T., & Snijders, T. A. B. (1999). Multilevel analysis of personal networks as dependent variables. Social Networks, 21, 187–209. doi.org/10.1016/S0378-8733(99)00009-X

  8. Wellman, B., & Frank, K. (2000). Network Capital in a Multi-Level World: Getting Support in Personal Communities. Social Capital, 233–273. [ResearchGate]

  9. Hox, J. (2002). Multilevel analysis techniques and applications. Lawrence Erlbaum Associates Publishers. [ResearchGate]

  10. Müller, C., Wellman, B., & Marin, A. (1999). How to use SPSS to study ego-centered networks. Bulletin de Méthodologies Sociologiques, 64. doi.org/10.1177/075910639906400106

Read More
Reports Gabriel Hales Reports Gabriel Hales

Report: Gaps in students’ broadband and achievement across the pandemic

The COVID-19 pandemic rapidly changed how Americans viewed the importance of broadband Internet connectivity. In a short period of time, a national emergency shifted how and where people accessed work and education, how they interacted with friends and family, and how they spent their time. An inadequate infrastructure for broadband access left rural Americans and particularly rural youth at higher risk.

This study assessed the impact of the COVID-19 pandemic on home Internet connectivity, student achievement, and adolescent well-being. The focus is on middle and high school students enrolled in rural and small-town schools.

The COVID-19 pandemic rapidly changed how Americans viewed the importance of broadband Internet connectivity. In a short period of time, a national emergency shifted how and where people accessed work and education, how they interacted with friends and family, and how they spent their time. An inadequate infrastructure for broadband access left rural Americans and particularly rural youth at higher risk.

This study assesses the impact of the COVID-19 pandemic on home Internet connectivity, student achievement, and adolescent well-being. The focus is on middle and high school students enrolled in rural and small-town schools.

[NOTE: this overview was originally published by the Quello Center]

Background and motivation

The COVID-19 pandemic rapidly changed how Americans viewed the importance of broadband Internet connectivity. In a short period of time, a national emergency shifted how and where people accessed work and education, how they interacted with friends and family, and how they spent their time. An inadequate infrastructure for broadband access left rural Americans and particularly rural youth at higher risk. This study was designed to assess the impact of the COVID-19 pandemic on home Internet connectivity, student achievement, and adolescent well-being. The focus is on middle and high school students enrolled in rural and small-town schools.

This report builds on the findings of a study on Broadband and Student Performance Gaps released in the weeks before the start of the COVID-19 pandemic (Hampton et al., 2020). That report highlighted the low levels of broadband access by rural Michigan students and the detrimental impact from a lack of access on their academic performance, educational aspirations, career choices, and general well-being. In 2022, we returned to the same schools that we first surveyed in 2019. We asked students about their experience with Internet technologies and with learning from home during the pandemic. Our findings paint a picture of how rural school districts and other stakeholders rapidly mobilized to address a national crisis. In a remarkably short period of time, schools accessed state and federal resources to close gaps in rural Internet access and computing devices.

Primary findings

At the height of the COVID-19 pandemic, during the 2020-21 school year, the vast majority of rural Michigan students spent considerable time learning from home like many students across the country. Our findings show that students with better home Internet access experienced fewer problems learning from home.

We found evidence that learning from home boosted students’ competencies with digital technologies. It also helped insulate some students from a broad pandemic decline in career interests related to science, technology, math, and engineering (STEM). 

During the COVID-19 pandemic, learning from home did not, however, protect students from a large drop in intention to pursue post-secondary education at a college or university. Although students reported exceptionally high feelings of isolation during the pandemic, these feelings have rapidly diminished.

We found no substantive difference in young people’s self-esteem in comparison to before the pandemic. Young people are now spending more time in person with their friends than they did in the years before the pandemic. As youth leisure activities shifted, we also found that those young people, who spend more time using a variety of media, especially social media, are spending the most time in person with friends.

Our methodology

This study is based on data collected in 2019 and 2022. In April and May 2022, we administered a twenty-minute, pen-and-paper survey to 2,949 students in eighteen rural Michigan schools. This procedure mirrored our efforts in the spring of 2019, when we surveyed 2,876 students in these same schools. In 2022, 72.3 percent of students enrolled in grades 8-11 completed our survey; in 2019 70.6% of students participated.

Infographic: Key findings from report, Broadband and Student Performance Gaps After the COVID-19 Pandemic [created by Gabriel Hales]


Recommended citation

Hampton, K. N., Hales, G.E., & Bauer, J. M. (2023). Broadband and Student Performance Gaps After the COVID-19 Pandemic. James H. and Mary B. Quello Center, Michigan State University.

Read More